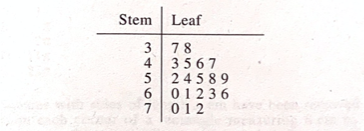
Interesting little factoid about the Math sections of the SAT and ACT – they both love testing your understanding of obscure STATISTICS concepts. The accompanying picture is of a “stem-and-leaf plot” that was used in an ACT problem recently. How it works is the “stem” is the tens part of the numbers, and the “leaf” is the units or ones part. Here are the numbers from the stem-and-leaf plot in the picture, written in full:
37, 38, 43, 45, 46, 47, 52, 54, 55, 58, 59, 60, 61, 62, 63, 66, 70, 71, 72
Make sense? Now, though stem-and-leaf plots are a pretty handy way of writing and comparing data, teachers routinely skip the stem-and-leaf unit in their classes (I know I did when I was a Math teacher!) which obviously makes it tough for students to get the right answer to questions that have stem-and-leaf plots! That’s why students need Test Prep pros like me. 😉